
A second opinion on your TradingView backtest
Write the strategy in TraderPier, backtest it in your browser and compare it with holding the stock on the same dates.
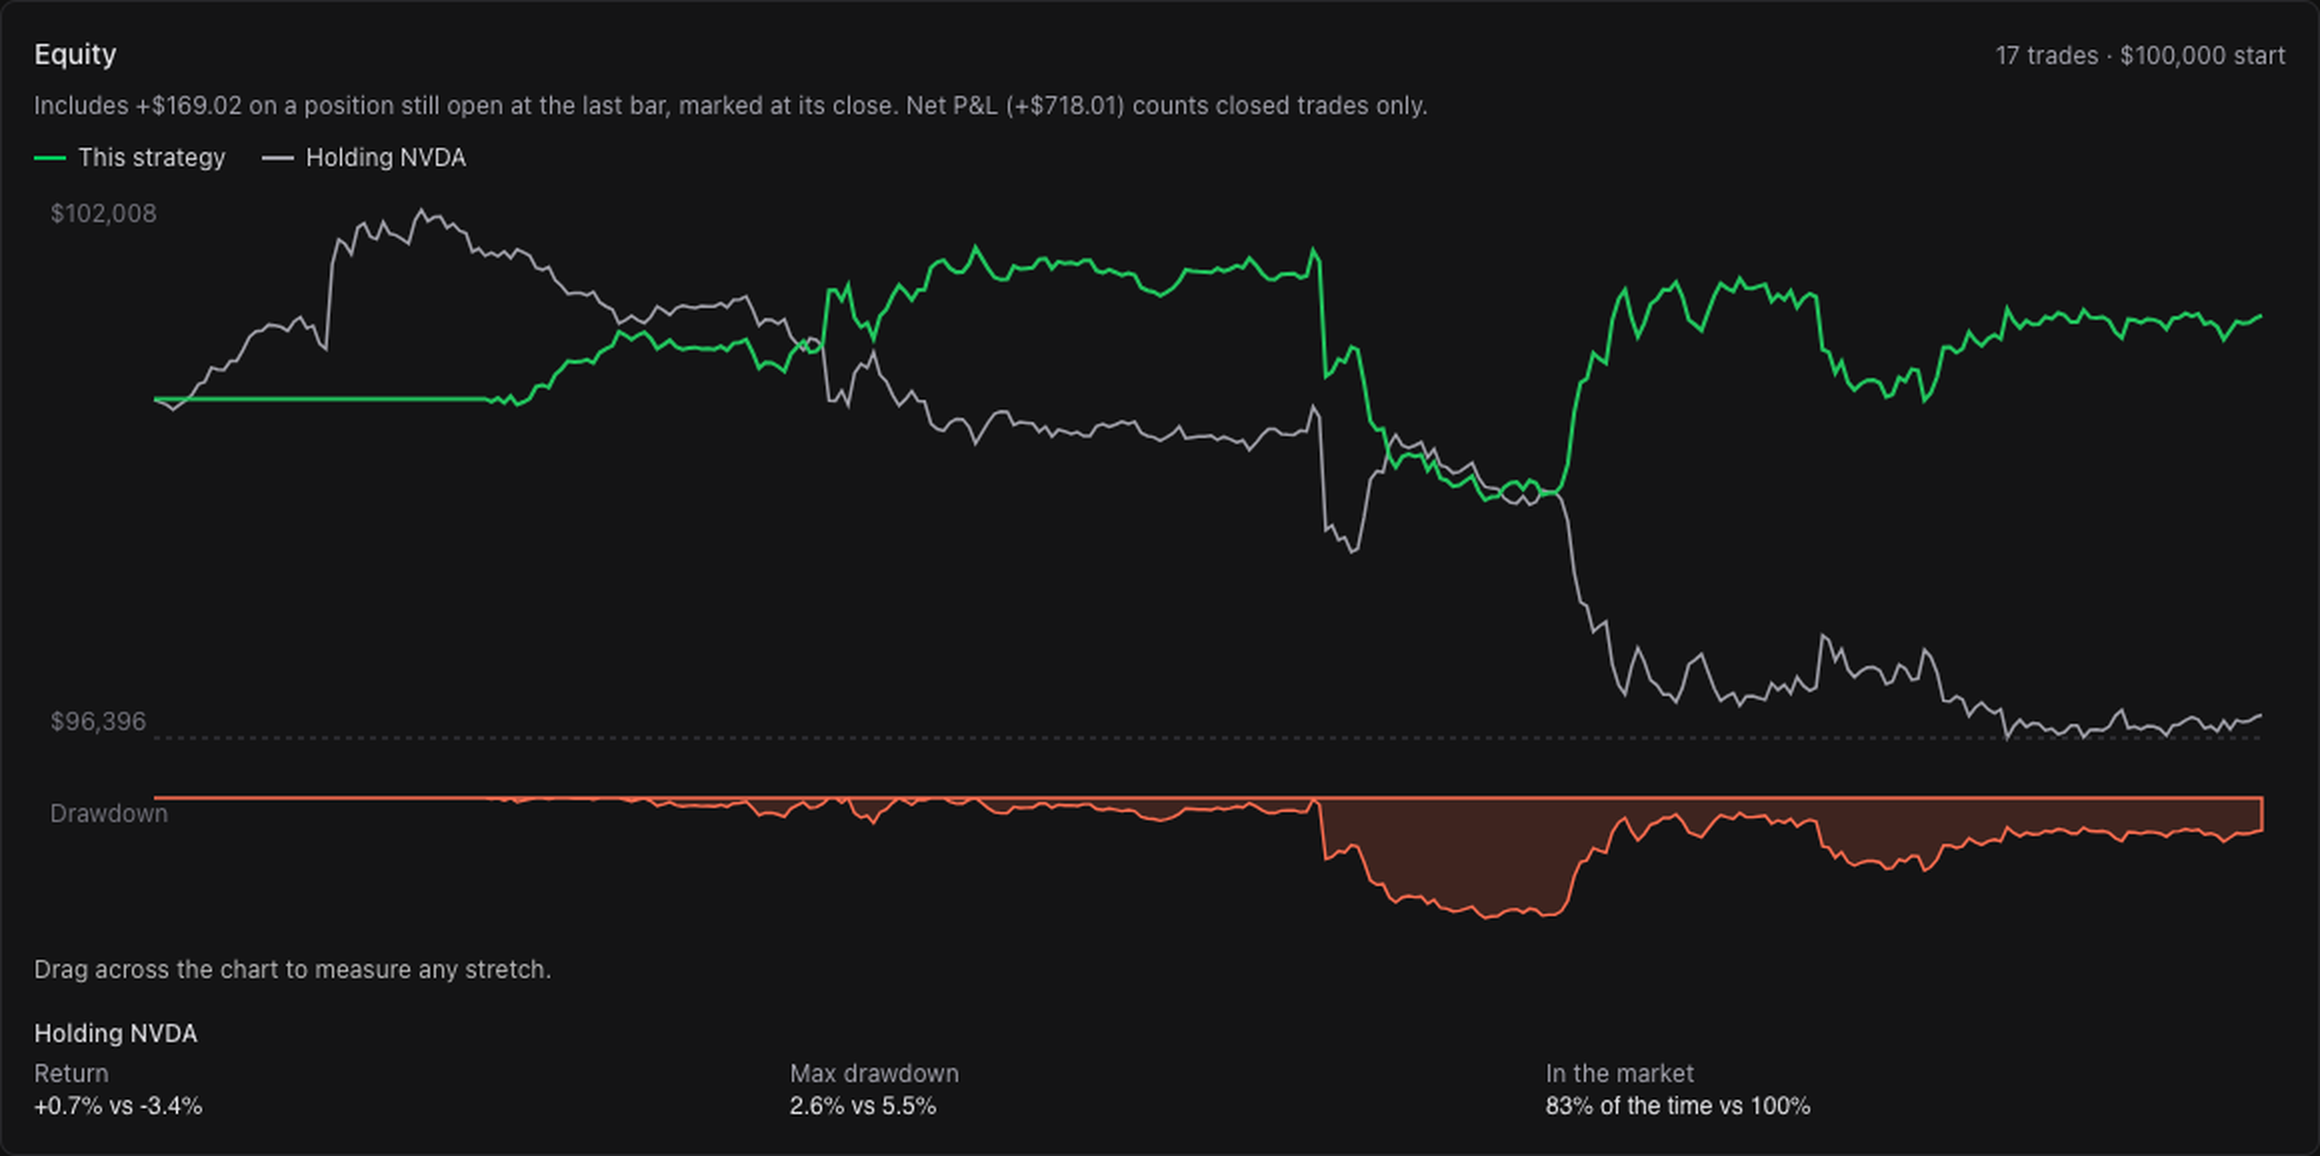
Example: SMA Crossover on NVDA, 5-minute bars, Oct 5 to Oct 9, 2026.
On every run
Compare it with holding the stock.
Net P&L is after commissions and slippage, and holding the same stock is drawn on the same chart. With 30 trades or more, the result also shows whether luck alone could explain it.
On the Trader plan
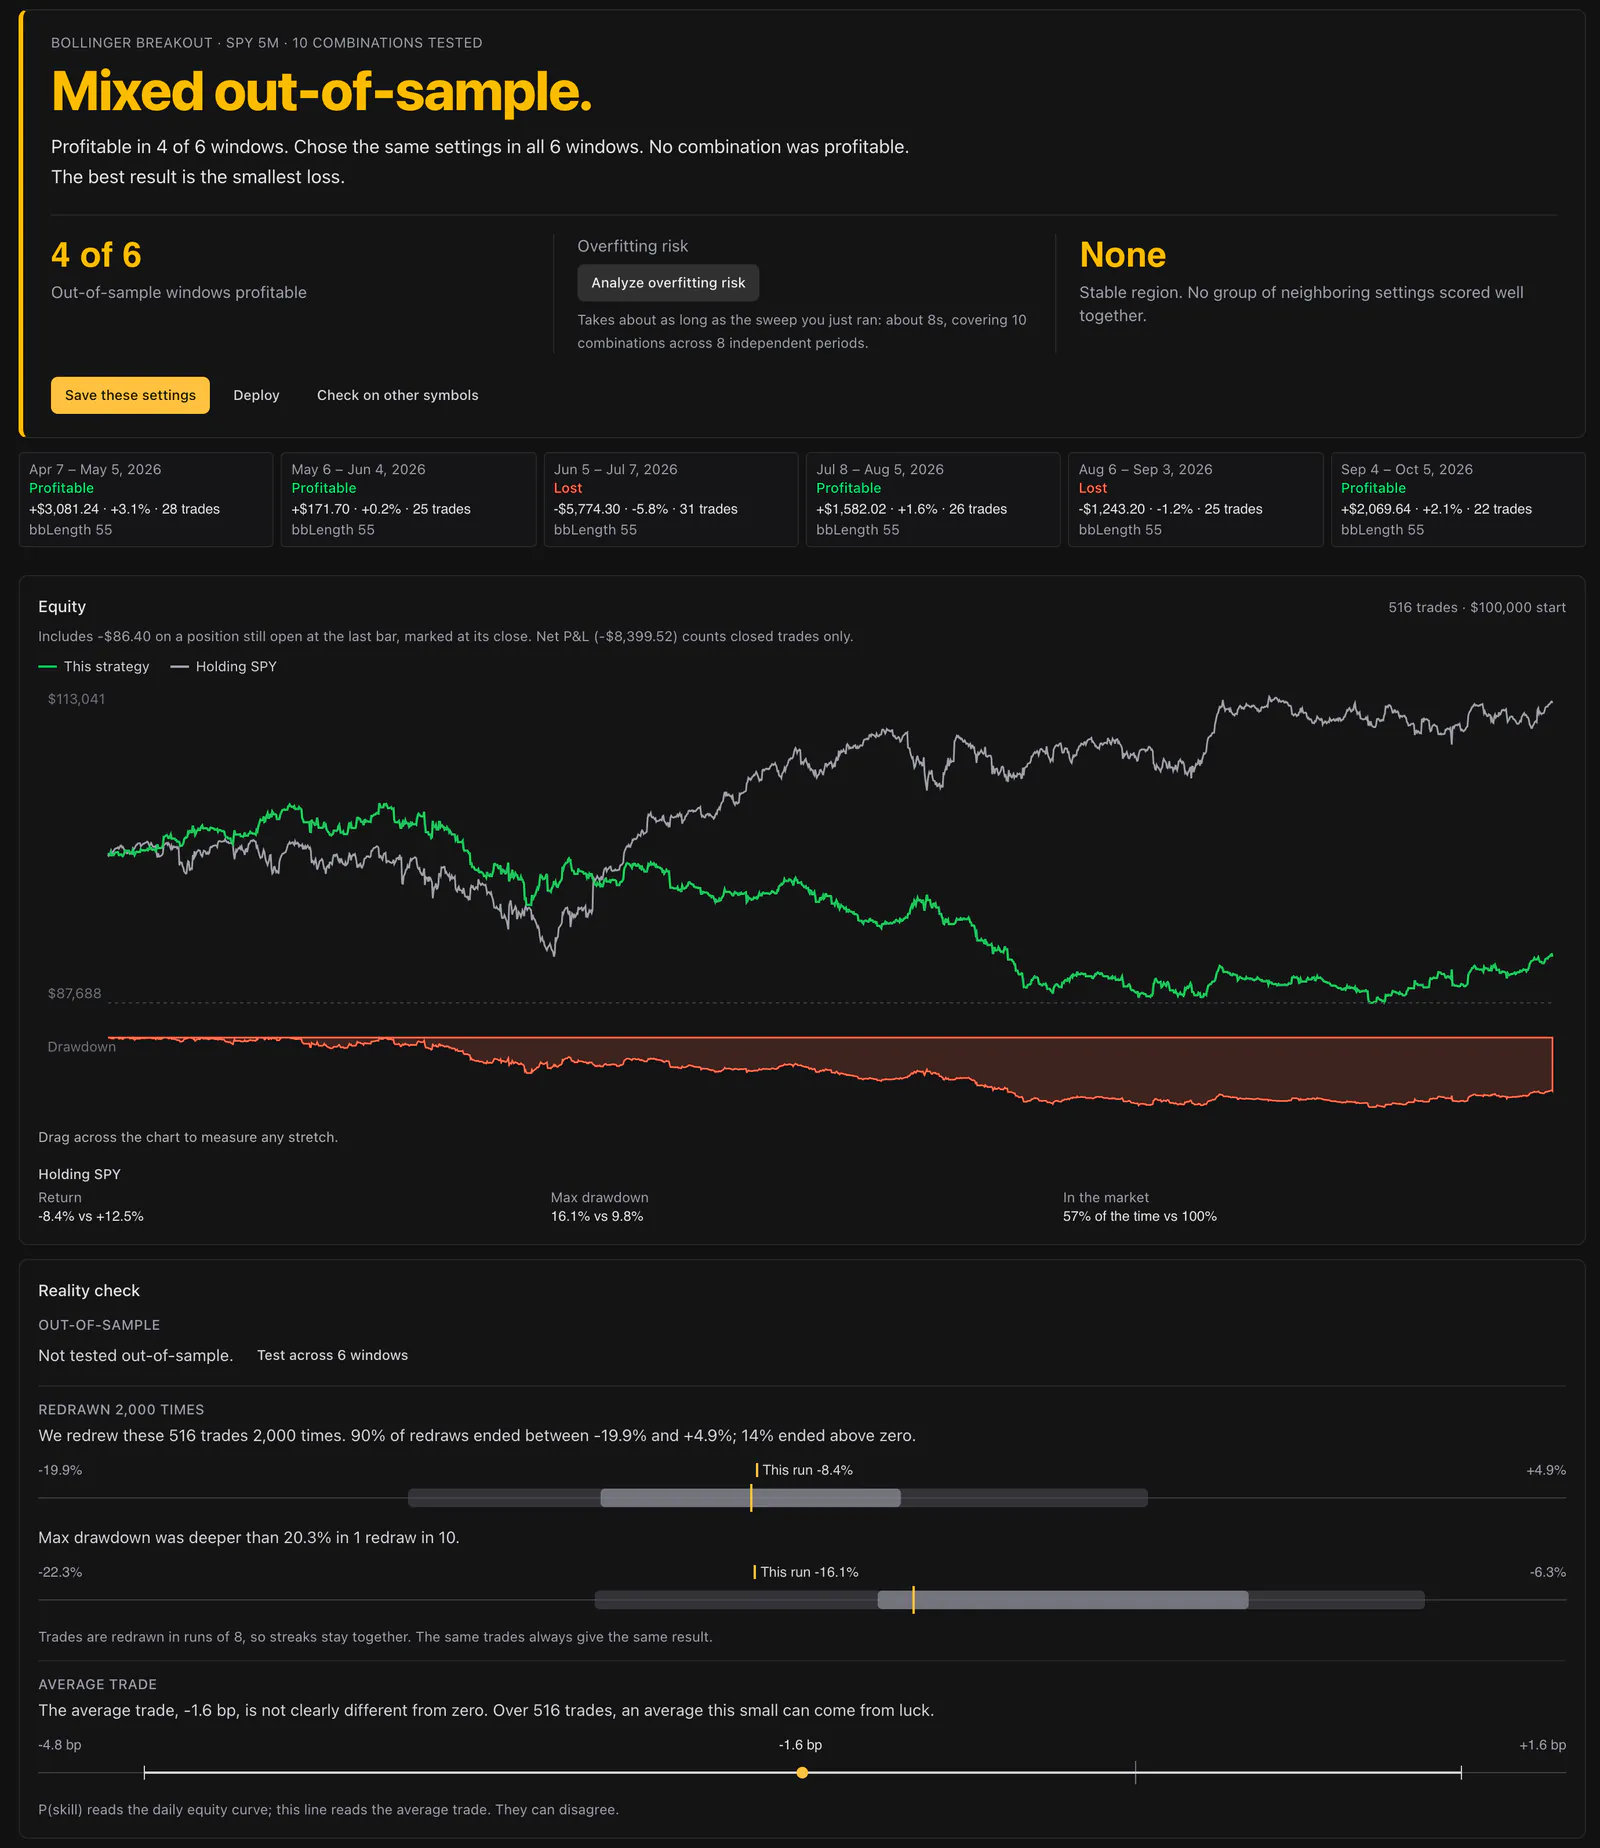
Test your settings on dates they were not optimized on.
Optimize picks the best settings on one stretch of history and tests them on the next, then shows how many stretches stayed profitable.
Questions
Before you try it.
How much history can I test?
30 days free, or a year on the Trader plan for $29 a month.
Do I need an account?
No. You can run one backtest a day without one. A free account backtests 30 days of history and saves your runs.
Which markets can I test?
US stocks and ETFs.
Read more
More on testing a strategy.
Free backtesting software
What the free plan tests, and what Trader adds.
Backtest without code
Built-in strategies, or your rules traded by hand.
thinkorswim backtesting alternative
Backtest with no brokerage account.
Test a strategy
Paste a strategy and backtest it in your browser.
Manual backtesting software
Backtest by hand, with every trade journaled.
thinkorswim OnDemand alternative
Replay a past day without a brokerage account.
Backtesting
How the tester checks a result, from luck to walk-forward.