
Find out if your backtest is real before you trade it.
Know if your edge is real before you fund it.
strategy('SMA Crossover') .category('Strategy') .tags('trend-following') .input('fastLength', 'integer', { default: 8, min: 2, max: 200 }) .input('slowLength', 'integer', { default: 34, min: 5, max: 500 }) .input('source', 'source', { default: 'close' }) .state('prevFast', 'number') .state('prevSlow', 'number') .state('fastSMA', 'number') .state('slowSMA', 'number') .calculate(({ helpers, inputs, ta, state }) => { const sourceData = helpers.lookback(inputs.slowLength, inputs.source); const fastSMA = ta.sma(sourceData.slice(-inputs.fastLength), inputs.fastLength); const slowSMA = ta.sma(sourceData, inputs.slowLength); state.prevFast = state.fastSMA; state.prevSlow = state.slowSMA; state.fastSMA = fastSMA; state.slowSMA = slowSMA; return { fastSMA, slowSMA }; }) .entry(({ state }) => { const crossUp = state.prevFast <= state.prevSlow && state.fastSMA > state.slowSMA; const crossDown = state.prevFast >= state.prevSlow && state.fastSMA < state.slowSMA; return { long: crossUp, short: crossDown }; }) .risk({ stopLoss: 2, maxPositions: 1, positionSize: 100 }) .build();
Example: SMA Crossover on NVDA, Sep 3 to Oct 2, 2026.
Write your own strategy, or start from ours.
Test the exact rules you'd trade, not a rough version of them.
Test every variation at once. See which results are luck.
Find the version of your strategy that keeps working, not the one that peaked once.
Two strategies looked good. Only one passed.
Same stock, same dates, same test.
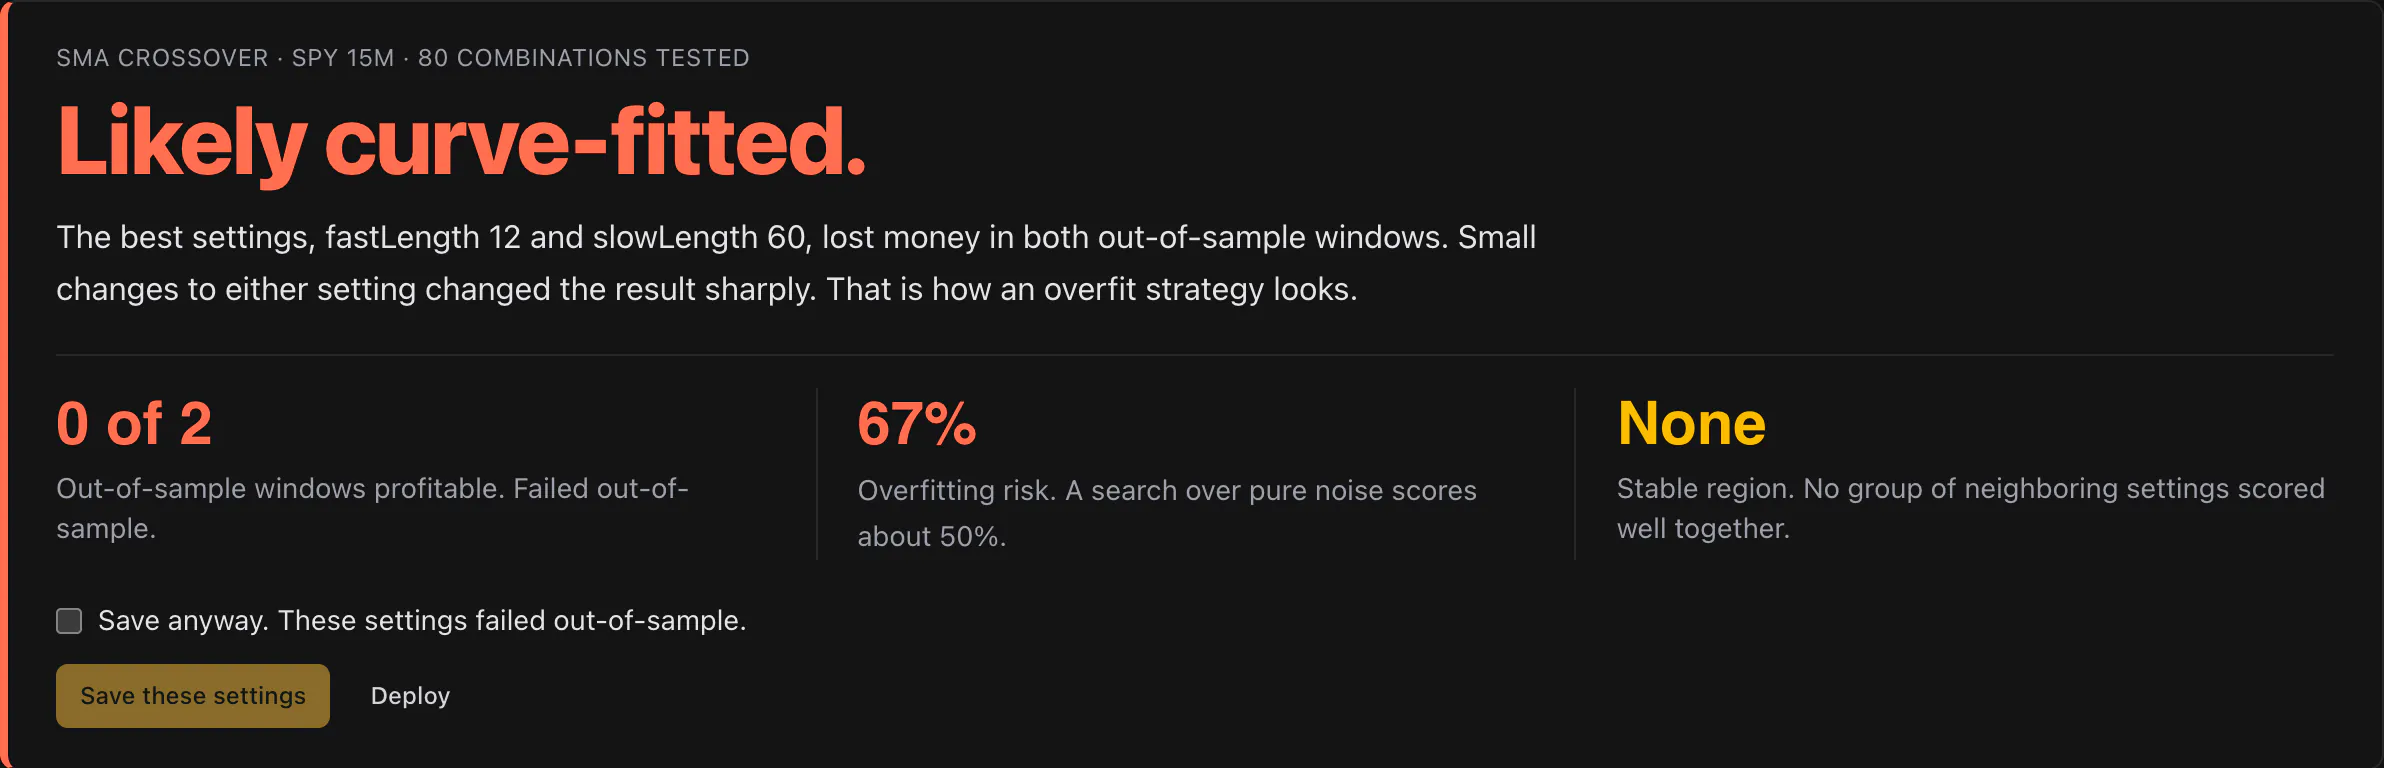
- Passed on new data
- 0 of 2
- Overfitting risk
- 67%
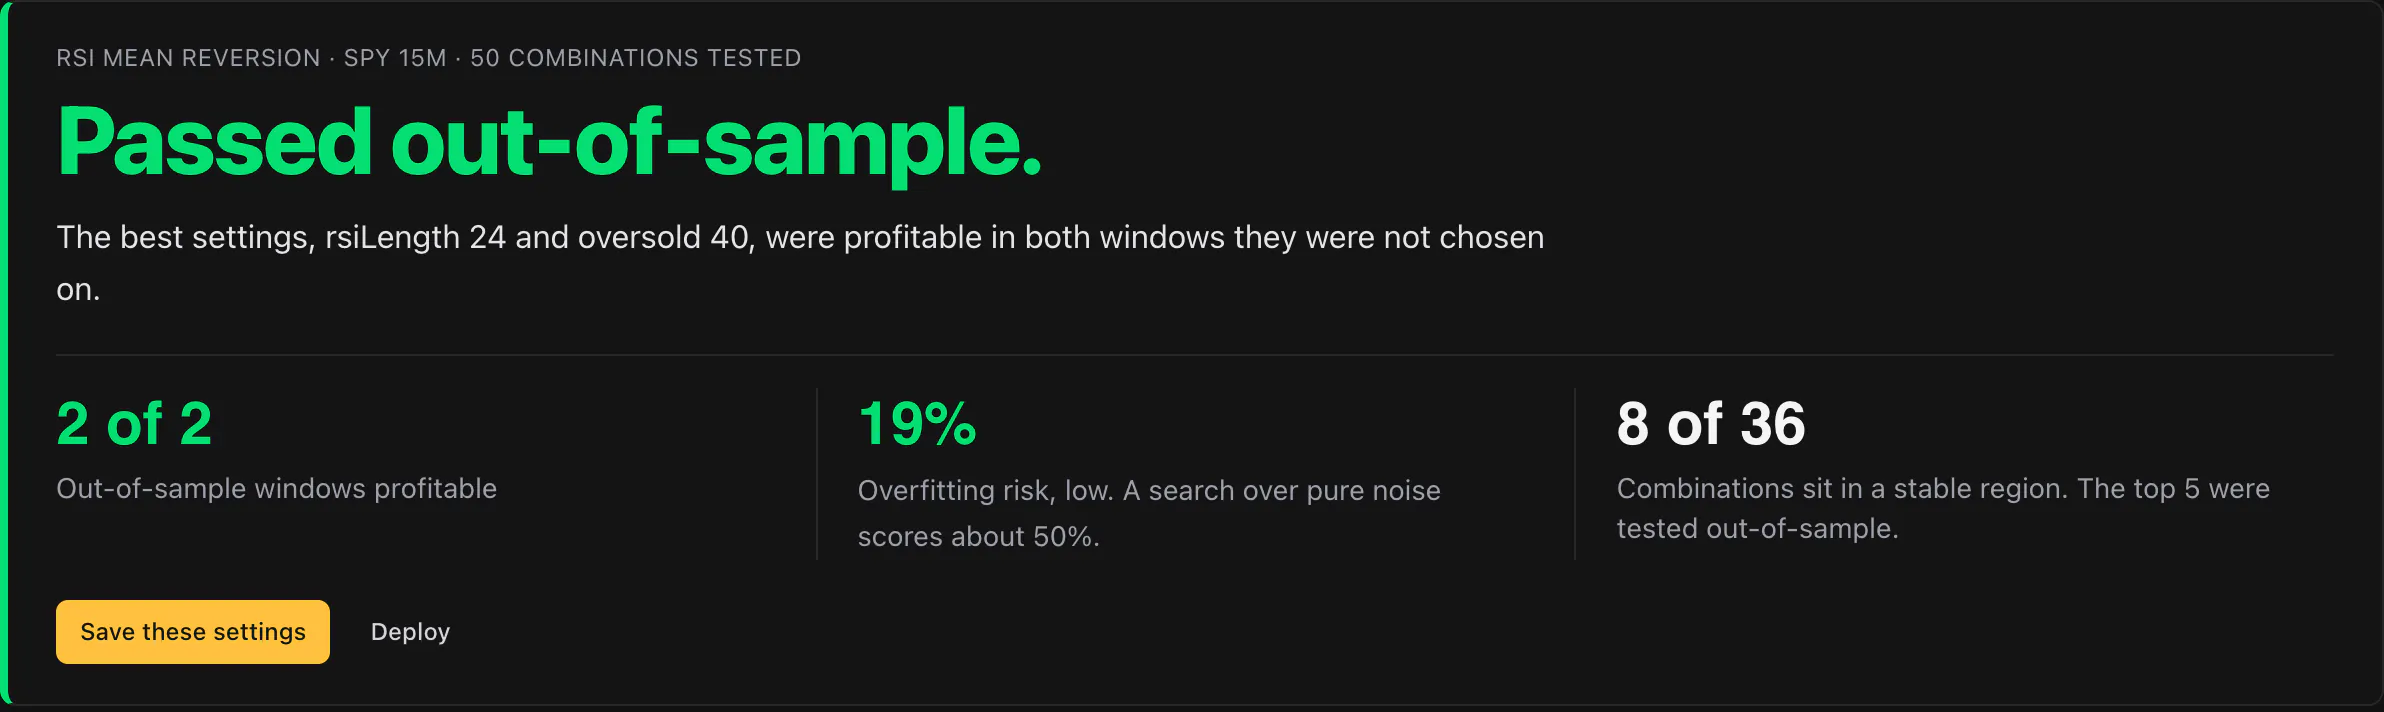
- Passed on new data
- 2 of 2
- Overfitting risk
- 19%
Example: SPY, 15-minute bars, Jan 2 to Oct 1, 2026.
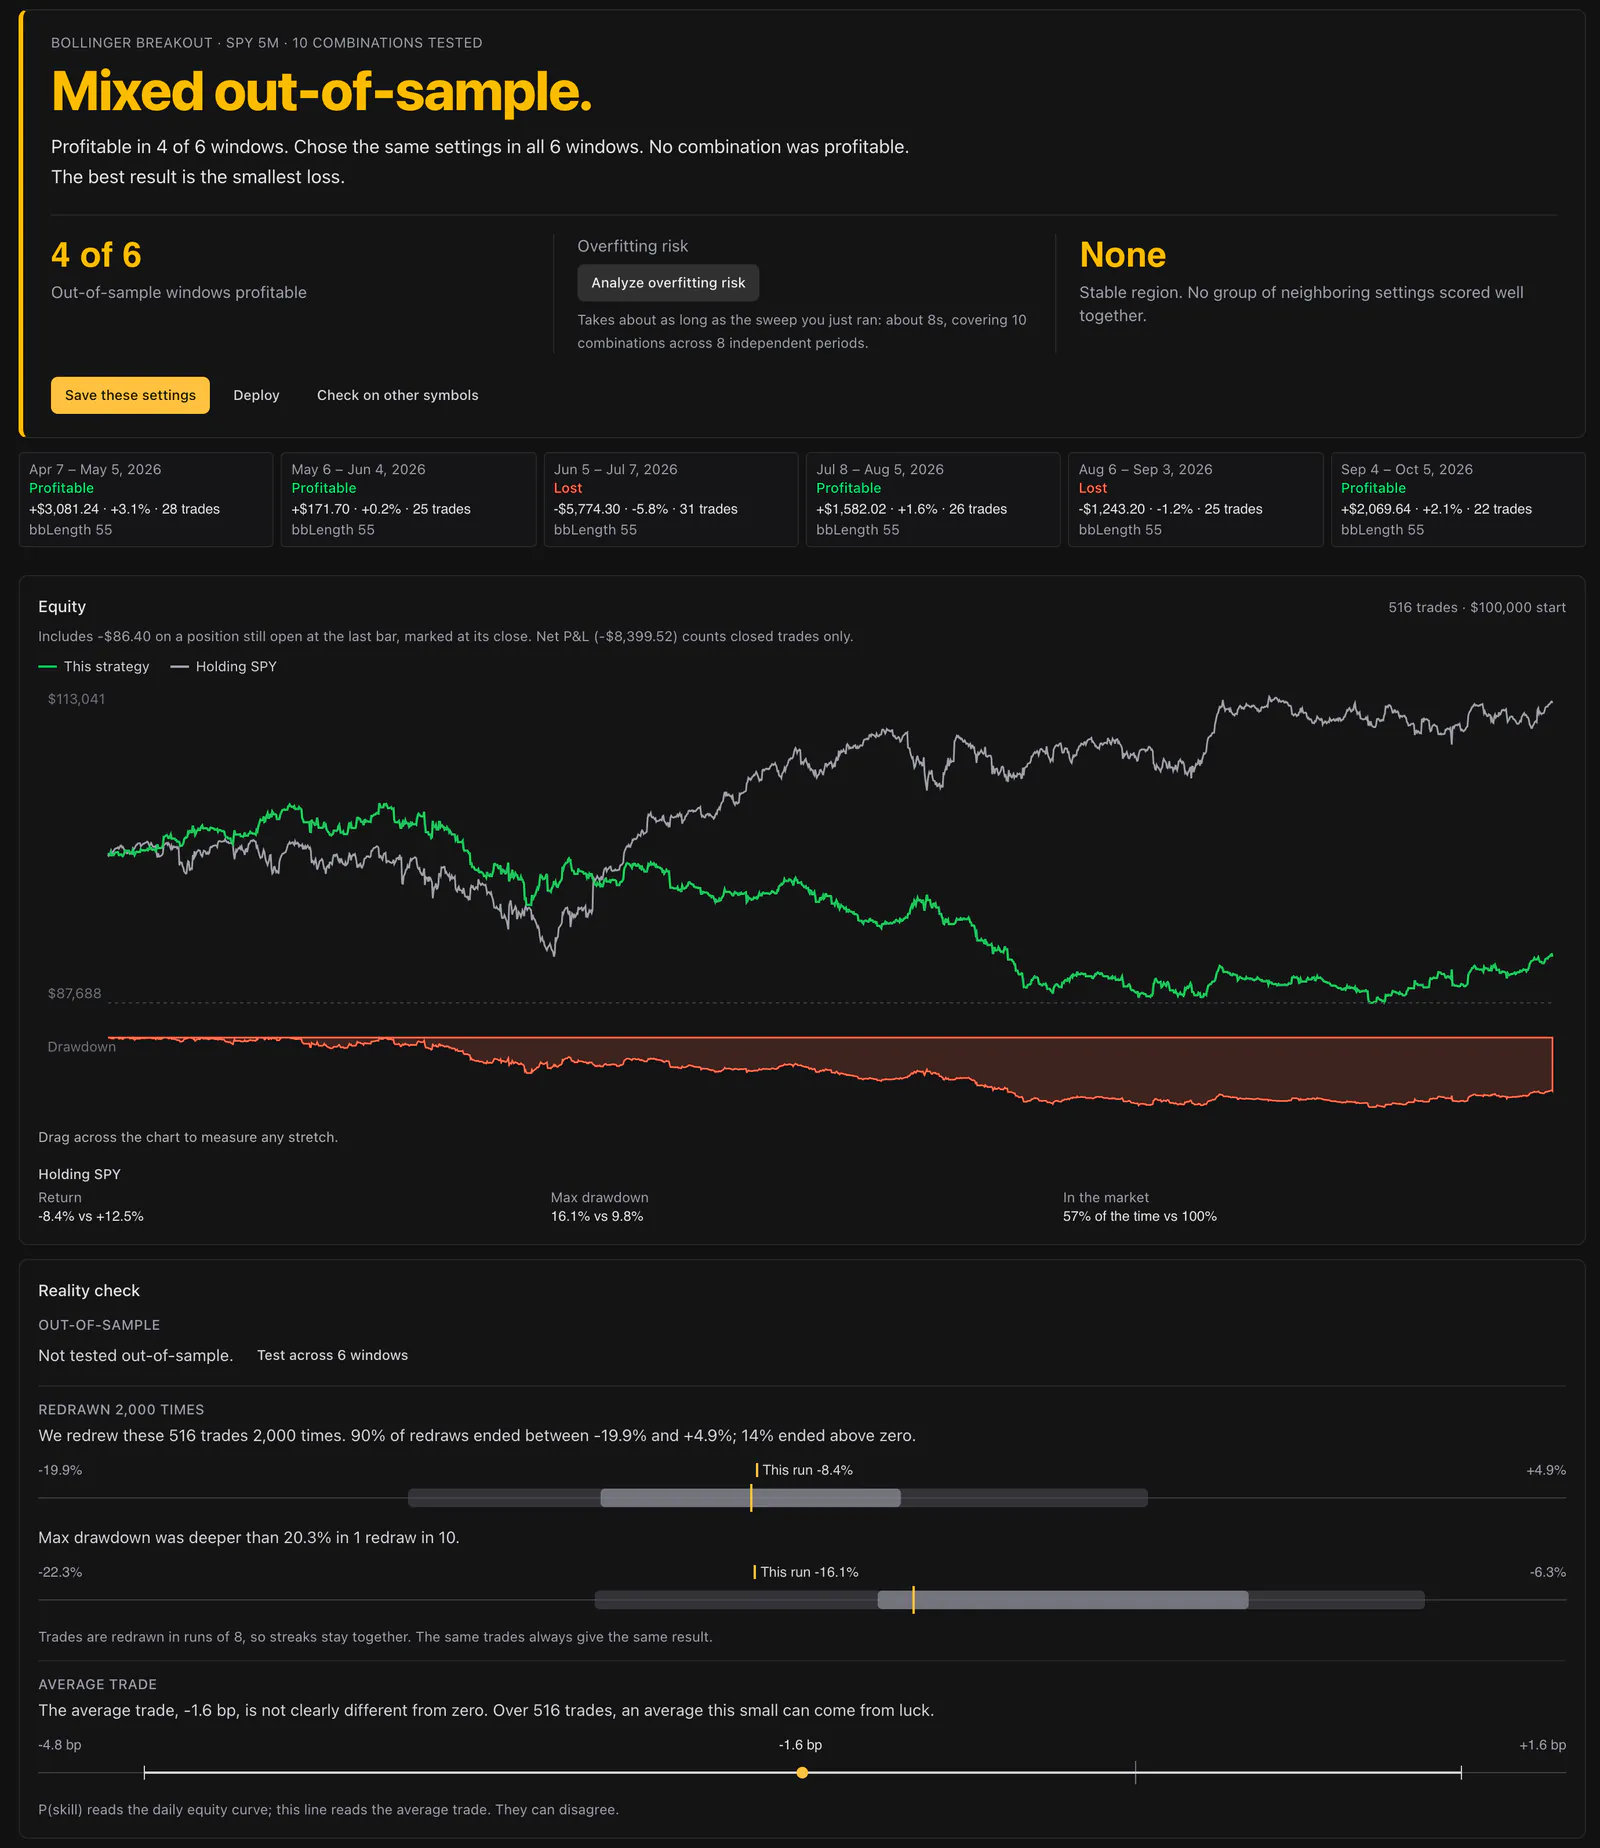
Three more checks before you trust it.
Walk-forward tests your settings on dates they never saw. The robustness check rebuilds the period 2,000 times from your own trades to show the range of outcomes. And holding SPY sits on the same chart: on these dates it made 12.5% while the strategy lost 8.4%.
Test every variation, not just one.
Upgrade to test every variation of a strategy at once, see whether the best one is overfit, and backtest a full year of history.
Questions
Do I have to write code?
No. Start from a built-in strategy and adjust it. Write your own in TypeScript when you want your own rules.
What can I backtest?
Any US stock or ETF, on minute or daily bars.
Can I trade a strategy once it’s tested?
Yes. Deploy it to a paper account from the same screen and watch it trade the live market.