
A backtest makes money, you trade the same rules for a few months, and the account goes nowhere. One common reason is also the easiest to check: the backtest ran with commission and slippage set to zero, while you pay both on every fill.
How much that hurts depends mostly on your stop. Commission and slippage are charged per share, so you pay about the same on a trade whether your stop is 25 cents away or a dollar away. The difference is the size of those cents next to the amount you risk. With a dollar stop, a few cents a share is a small fraction of each loss. With a 25-cent stop, it's a big piece of every loss and every win, and a strategy that makes money with costs at zero can lose most of that profit once you add them.
The first scalping strategy I backtested made money right up until I turned the costs on, and I've been suspicious of tight-stop backtests ever since.
One breakout, two stops
I tested this on an opening range breakout on SPY. It uses the high and low of the first 30 minutes after the 9:30 AM open. The strategy goes long on the first 5-minute close above that high and short on the first close below that low, takes one trade a day at most, and closes anything still open at 3:55 PM.
Only the stop changes between runs. It's a fixed distance from the entry, set as a percent of the entry price. I used 0.04% and 0.2%. At SPY's prices over these dates, that put the tight stop 20 to 31 cents from the entry and the wide one $0.99 to $1.56.
Every run used SPY's 5-minute bars from Mar 4, 2024 to Sep 30, 2026, with the whole $100,000 balance in each trade. I ran each stop twice in the Backtest tab: once with costs at zero, and once with the tester's default costs of $0.005 a share in commission and a cent a share of slippage on every fill. Slippage here means filling a cent worse than the price on the chart.
Same costs, very different results
With costs at zero, the tight stop made $4,645.45 over 642 trades. With costs, it made $1,516.30.
The wide stop made $27,260.48 with no costs and $23,714.30 with them.
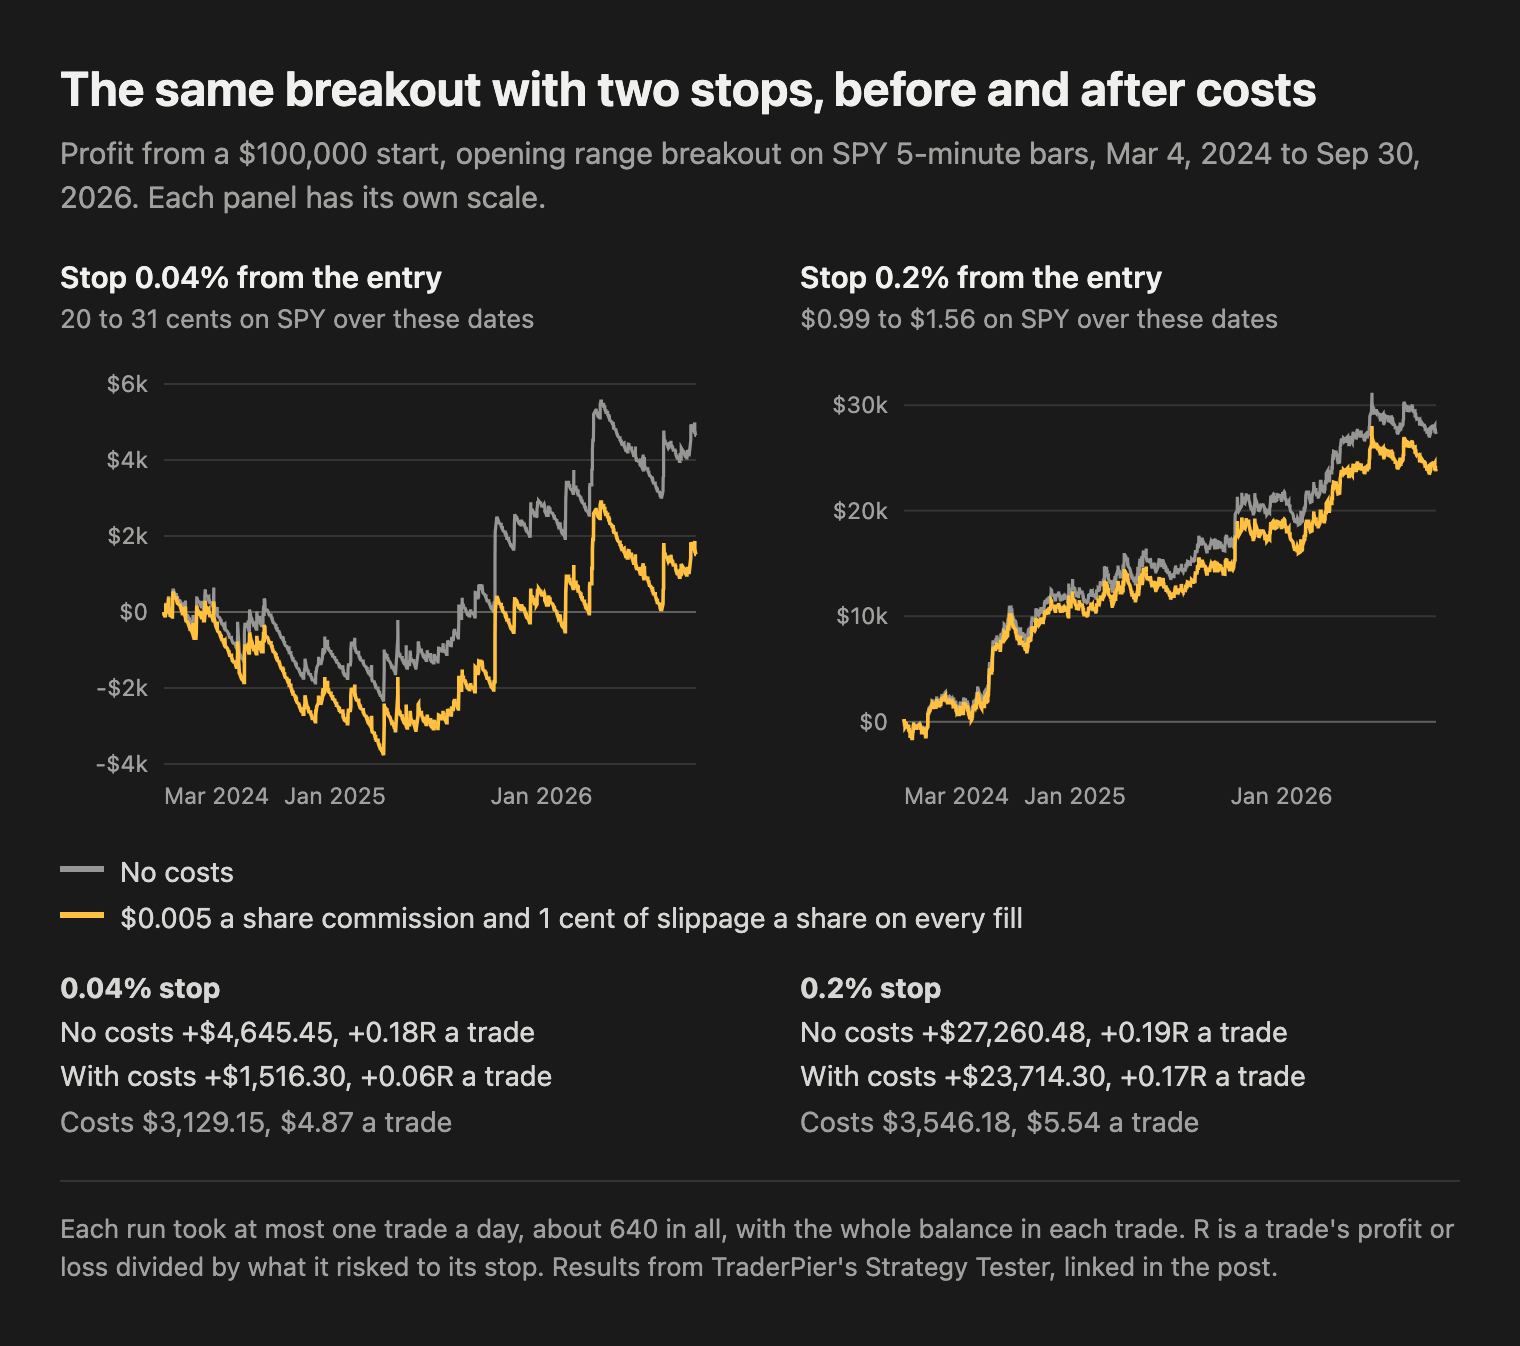
The gray line is each stop with no costs and the gold line is the same trades with costs, so the gap between the lines is the total cost. For the tight stop on the left, the gap opens early and keeps growing. For the wide stop on the right, the lines stay close the whole way.
Costs per trade were similar: $4.87 on the tight stop and $5.54 on the wide one. The amount at risk was not. A trade on the tight stop risked about $40, so costs were about an eighth of the risk. A trade on the wide stop risked about $230, so costs were closer to a fortieth.
R makes this easier to compare. R is a trade's profit or loss divided by the amount it risked to the stop, so a full stop-out is -1R. With no costs, both stops averaged almost the same per trade: +0.18R on the tight stop and +0.19R on the wide one. With costs, the wide stop still averaged +0.17R a trade, and the tight stop dropped to +0.06R.
Most of the cost was on losing trades
The tight stop won 9.2% of its trades. About two of every three trades hit the stop within 10 minutes of the entry, and all the profit came from the few trades still open at the 3:55 PM exit. Those winners were big, so costs made little difference to them: the average win went from $475.51 to $470.73.
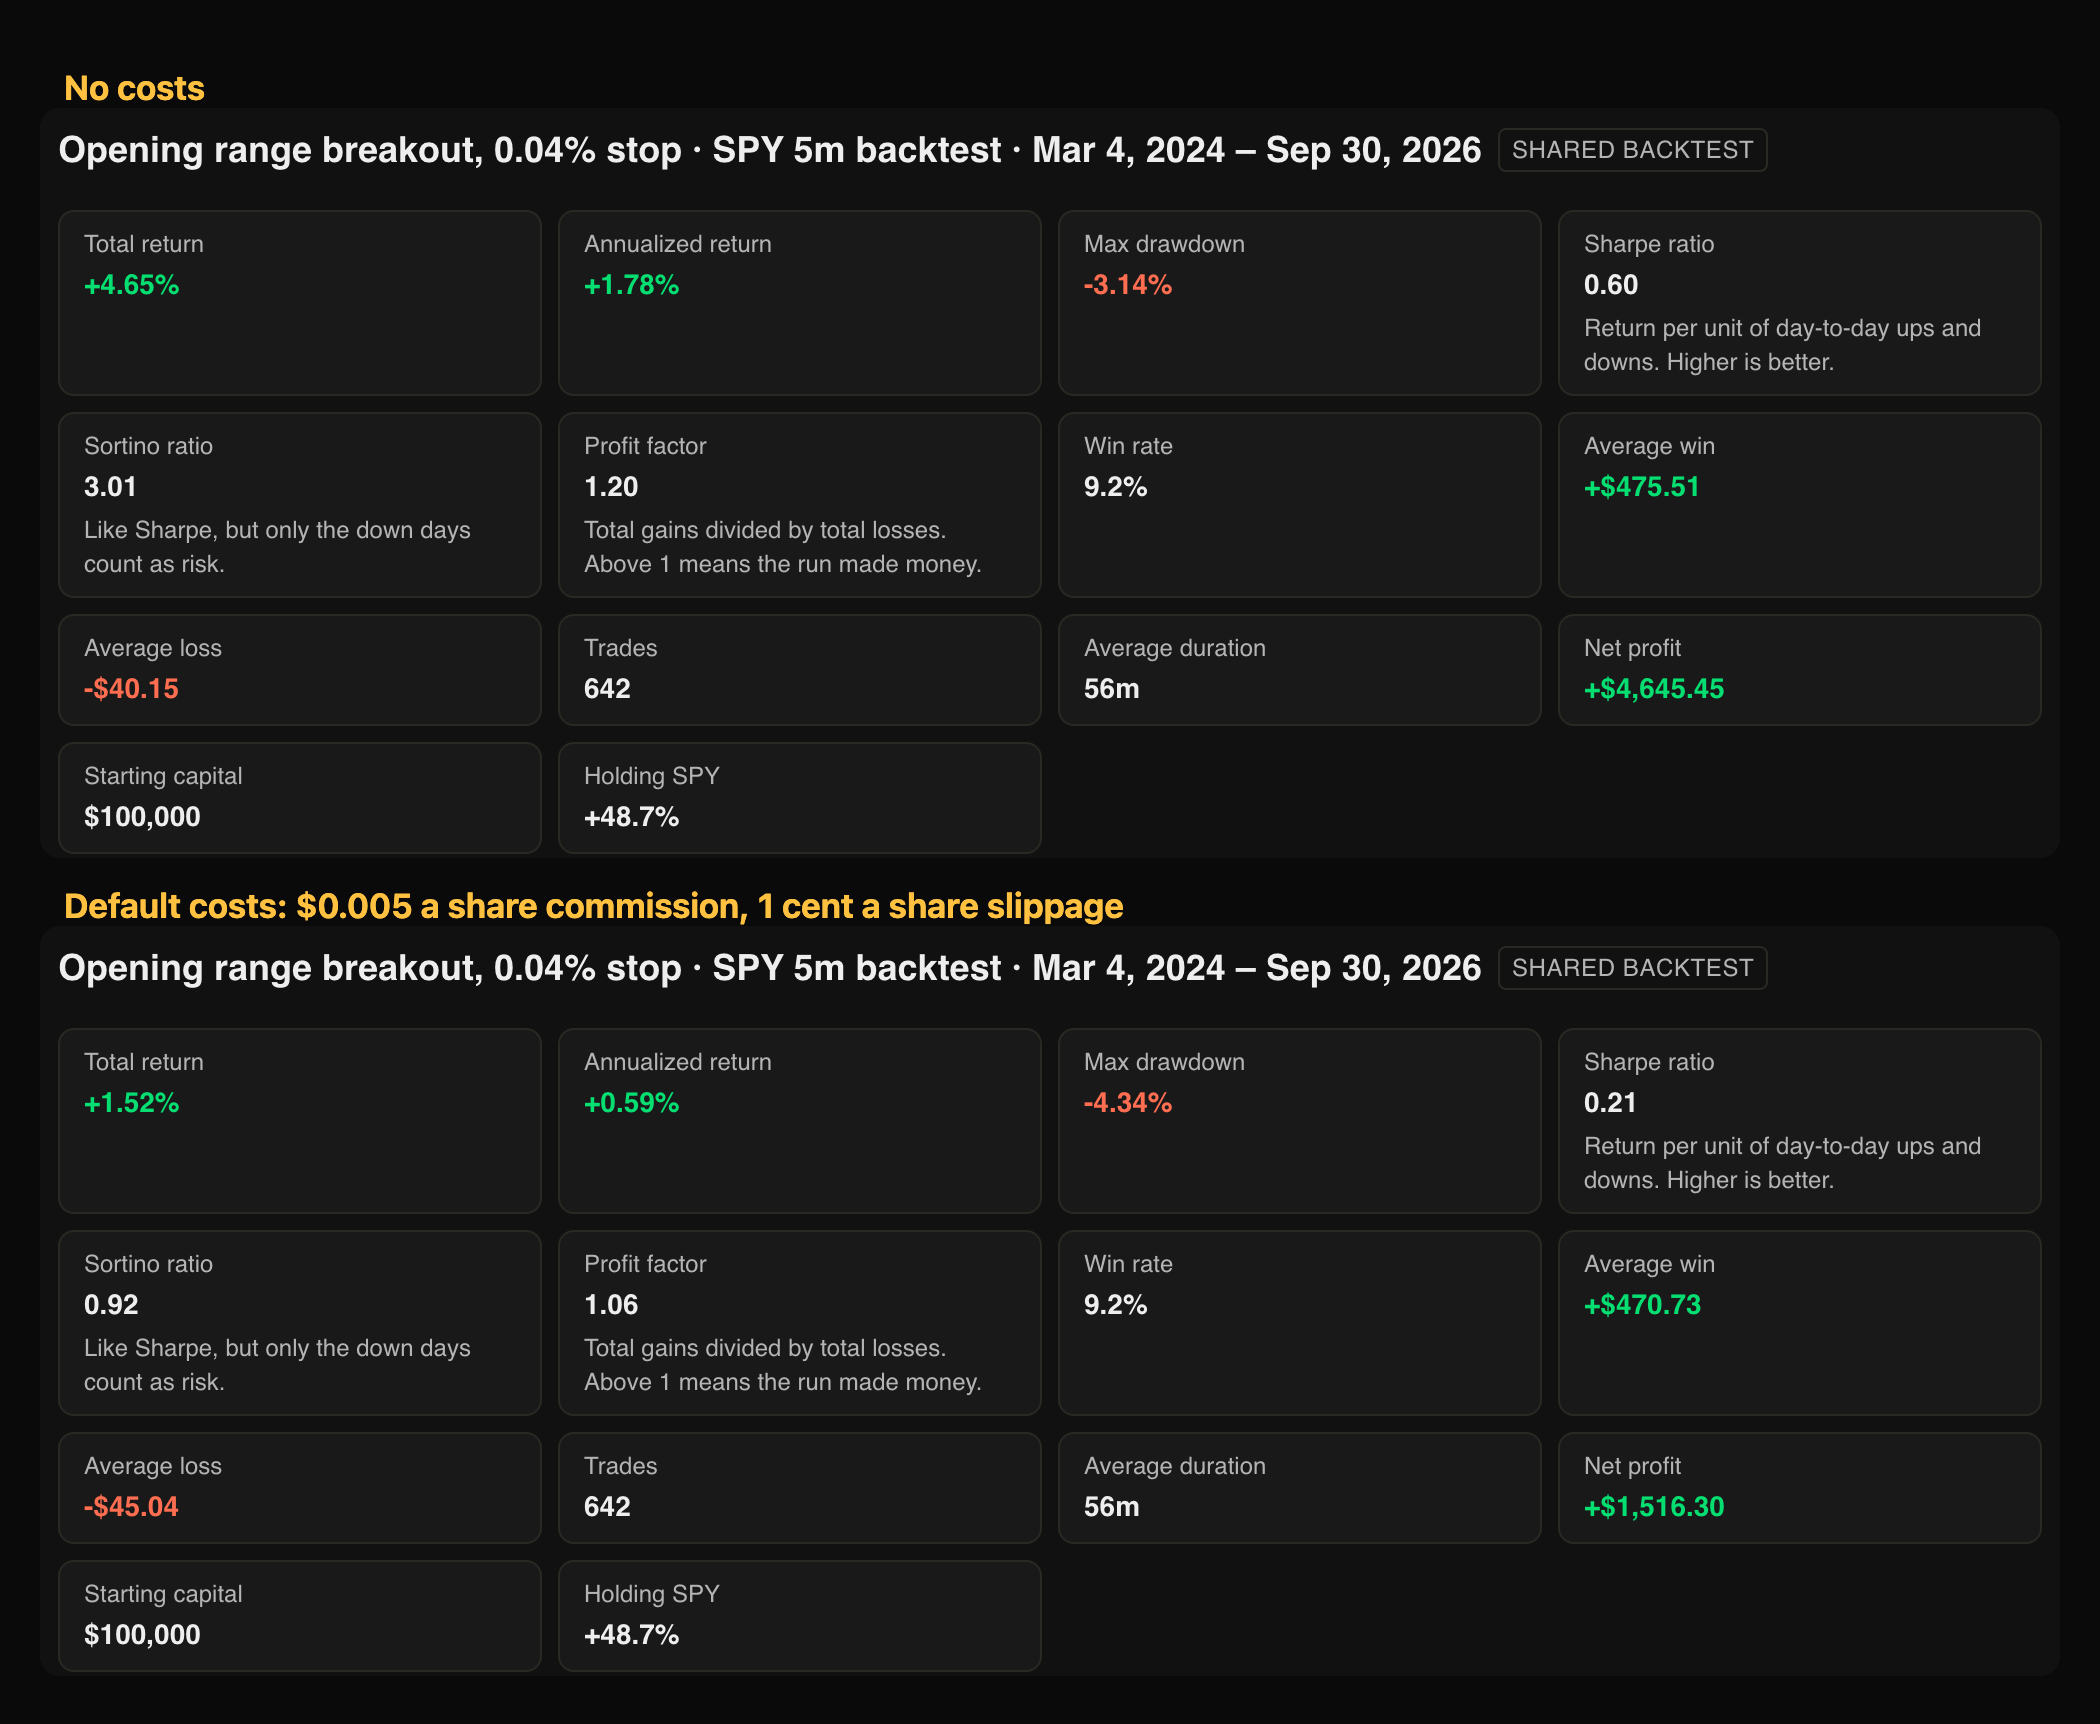
With no costs, the tight stop's average loss was $40.15. With costs, it was $45.04. There were 583 losing trades, almost all of them stop-outs, and each one was charged commission and slippage on the entry and again on the exit.
On the wide stop, costs per trade were about the same, but the losses were much bigger. The average loss went from $220.11 to $224.55.
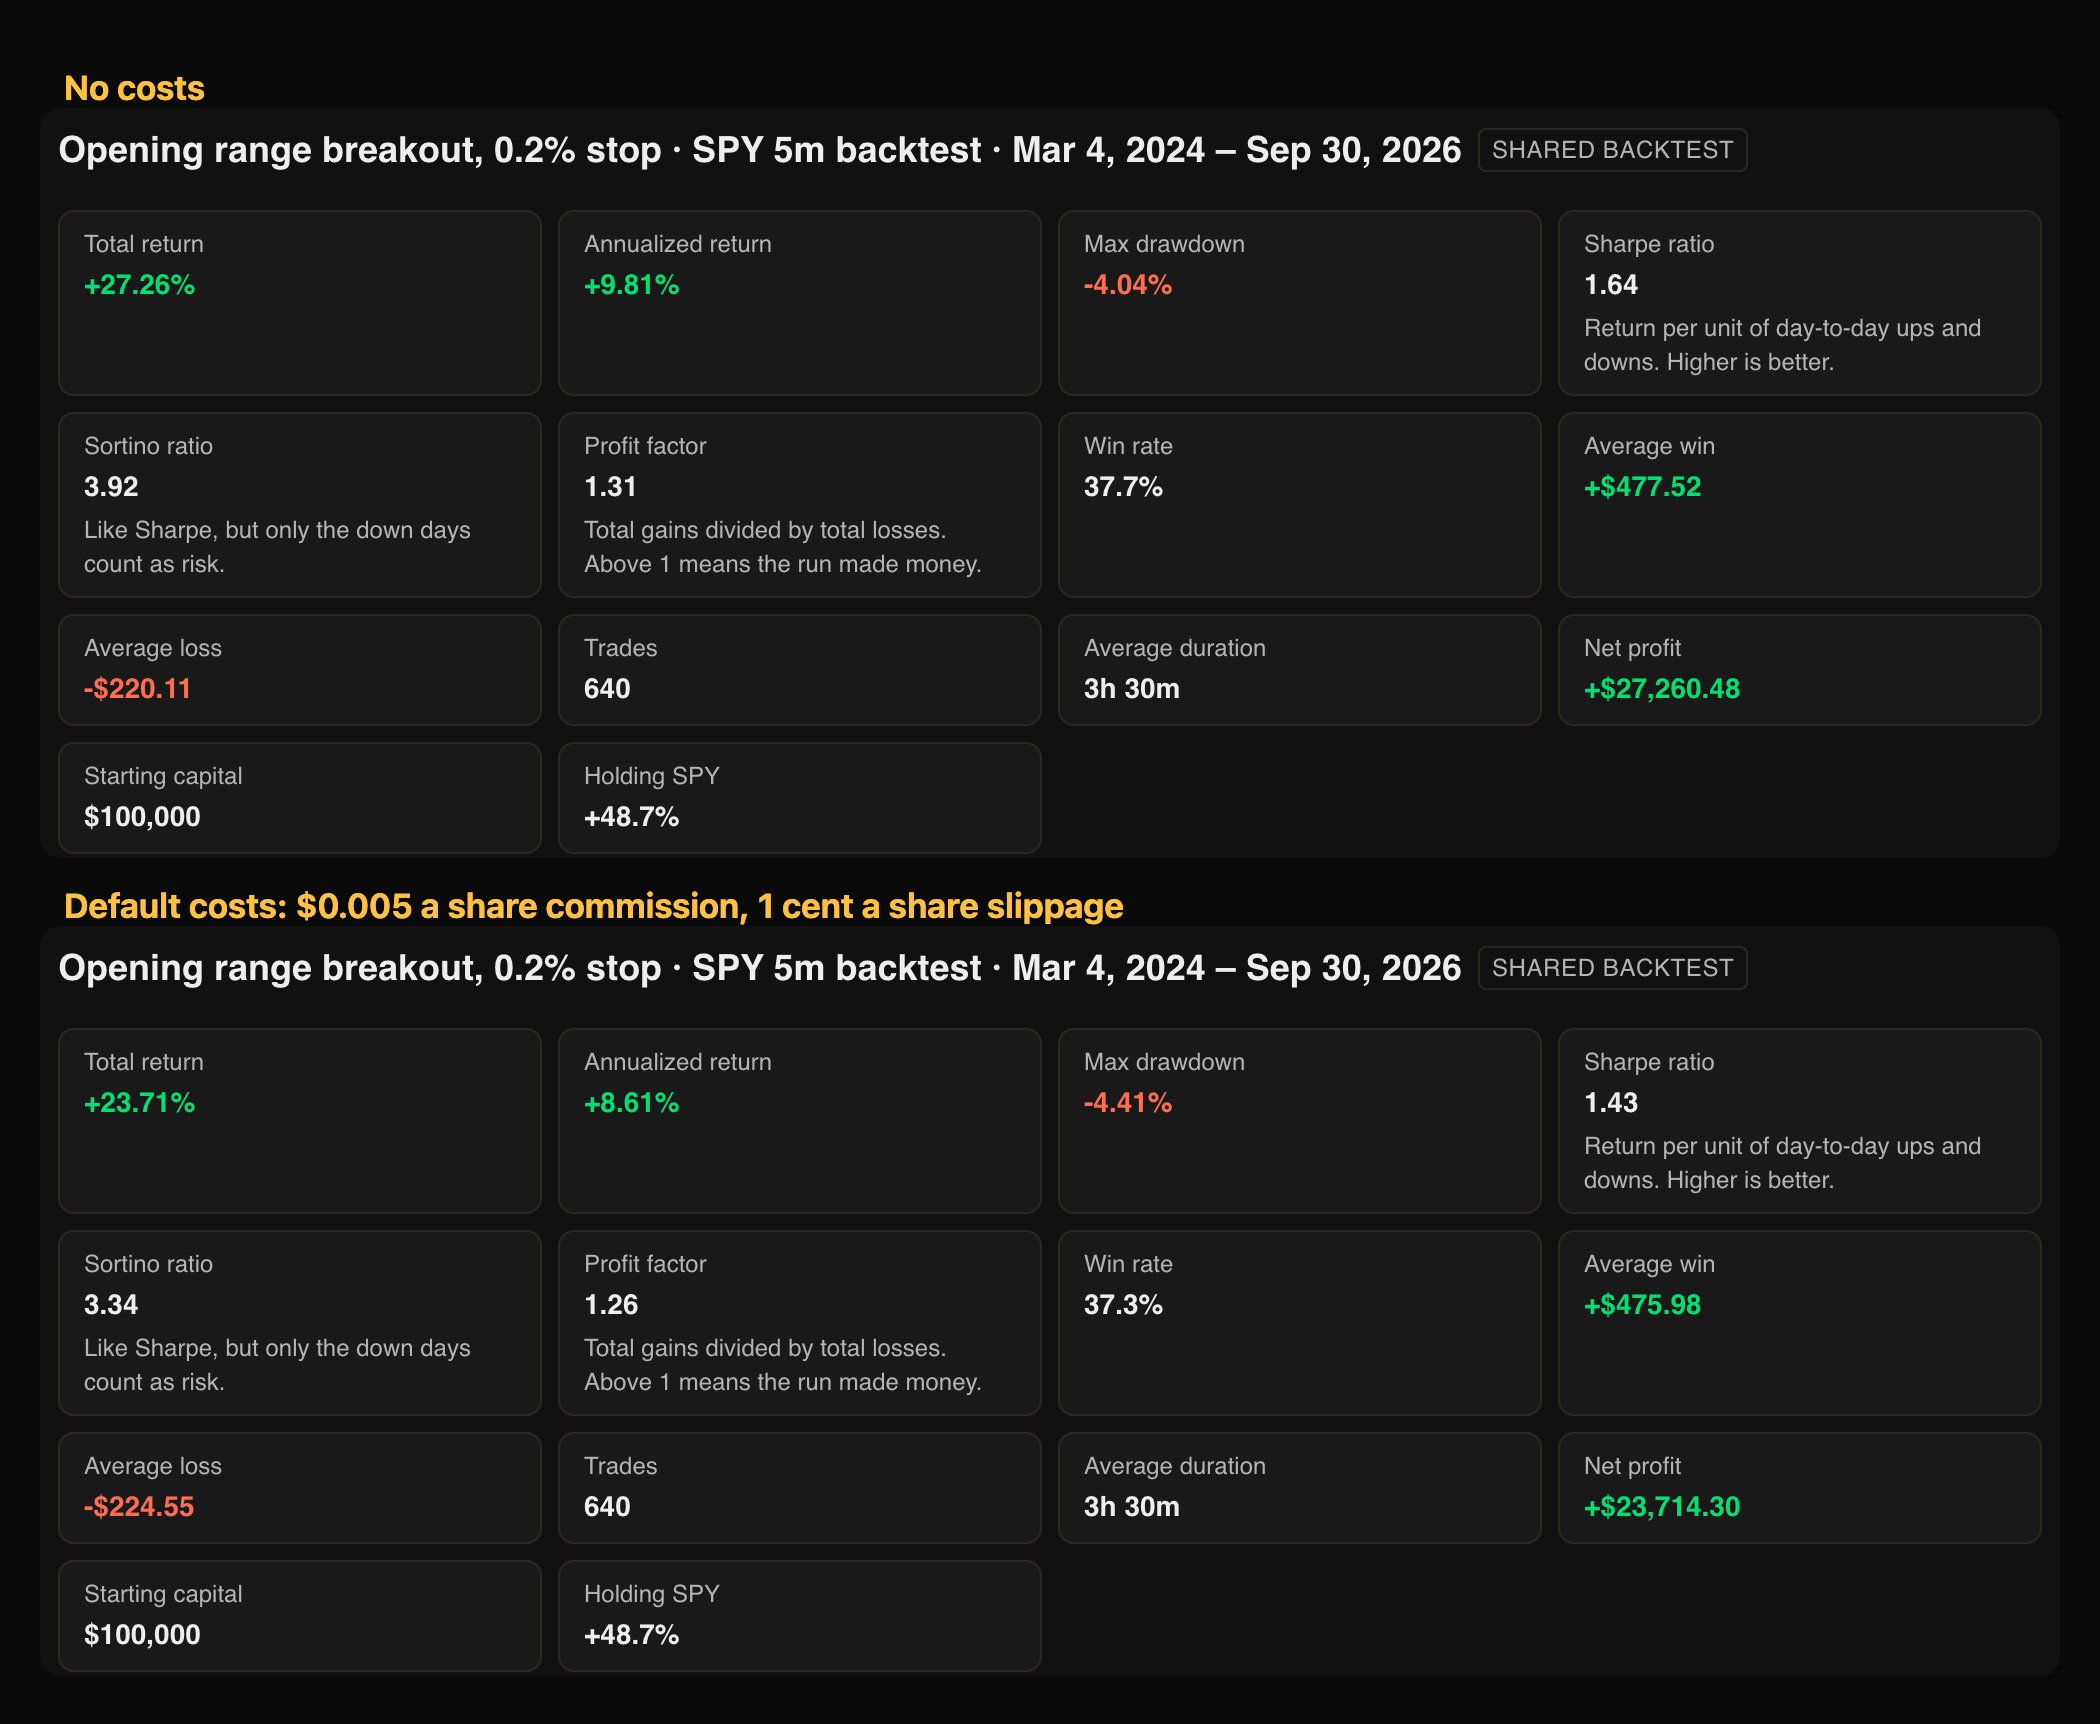
All four runs are public if you want to check the trades: the tight stop with no costs and with costs, and the wide stop with no costs and with costs.
What I'd check on a tight-stop backtest
The tight stop still made money here, but only about a third of what it made with costs at zero. With a smaller edge, the same costs would have turned it into a loss. Slippage is also a guess in any backtest. A cent a share is reasonable for SPY, but on a thinner stock it can be several cents, and each extra cent is five times as big a part of a 25-cent stop as of a $1.25 one.
Before I'd trade a strategy with a stop measured in cents, I'd run it twice, with costs at zero and with costs in, and compare the average trade in R. If it drops the way the tight stop's did here, from +0.18R to +0.06R, the result depends more on my slippage guess than on the rules.
The tighter the stop, the bigger the share of each trade's risk that goes to commission and slippage.